A Powerful Reversal From the $95 Floor
The international benchmark has staged one of the most decisive recoveries in recent memory. Brent futures slumped to $95.12 on 30 September after a sharp 7.3% single-day selloff on 25 September, but from that green demand zone the market began a steady climb. By 23 October the contract had reached $112.45, representing an almost 18% gain in under four weeks. The benchmark closed Friday's session at $111.70, still well above the psychological $100 mark it reclaimed on 8 October.
The sequence of higher lows tells the story of persistent buying pressure. The floor rose from $100.76 on 8 October to $102.33 on the 12th and then to $108.33 on the 23rd. A 3.72% impulse push carried price to $110 on 16 October, setting the stage for the subsequent advance. The structure, as one analyst observed, is "unusually clean," and the stakes for CFD traders are correspondingly high.
Technical Picture: EMA, Cup-and-Handle, and the Ceiling
A 10-day exponential moving average calculated from daily closes has acted as a reliable support line. Since 1 October, Brent has closed above that level in every session, with only minor intraday dips on 20 and 21 October that were quickly bought back. That pattern signals that dip-buying interest remains strong.
Looking at a longer timeframe, analysts have identified a rounding-bottom or "cup" formation that originated near $70.86 in mid-summer. The 50-day moving average sitting above the 200-day further confirms a higher-order uptrend. The key takeaway, as the source stresses, is to use moving averages for gauging the prevailing trend rather than as mechanical entry or exit triggers.
The critical level now is $112.80. On 23 October Brent peaked at $112.45, falling just 35 cents short of that ceiling. A confirmed daily close above $112.80 would signal a breakout and open the door to $120, with $125 as the subsequent magnet. Conversely, a rejection at resistance would likely pull price back toward the $104 area, with $100 as the next target and the broader demand zone spanning $94.85 to $96.00 as the final support shelf.
Market Context: Geopolitics, the Fed, and Cross-Asset Spillovers
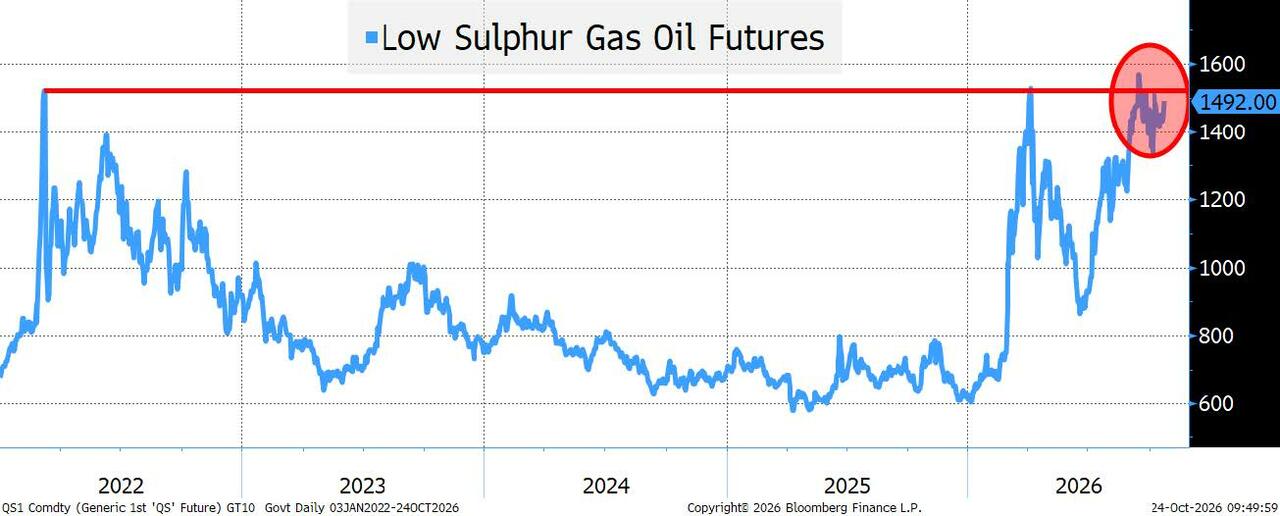
Supply concerns and geopolitical risk continue to dominate energy-market headlines, keeping crude at the centre of broader macro discussions. The rally to above $100 also put Brent on course for its largest monthly gain since July, amplifying the narrative.
However, the surge is not without secondary effects. The move to $112 per barrel has fuelled hawkish expectations around the Federal Reserve, and that shift in rate expectations has already been felt in precious metals, with silver coming under pressure. In emerging markets, the combination of higher oil prices and foreign institutional investor selling weighed on India's Sensex and Nifty indices, illustrating how crude moves ripple through equities and currencies worldwide.
A practical note for traders: spot and futures prices are not identical. The EIA spot series tracked on FRED printed roughly $10 above the futures contract on 20 October. Understanding which reference your broker uses is essential before sizing a position.
Risk Management and Position Sizing
The source is explicit about the operational risks that come with trading oil CFDs. Spreads tend to widen during headline-driven volatility, rolling contract expiries can shift the reference price, and leverage magnifies both gains and losses in equal measure. The recommended discipline is to trade smaller than what feels exciting, place stop-losses beyond the level that would invalidate the thesis, and never average down on a losing position.
Writing down entry, stop, target, and size before pressing the trade button is presented as the single most important habit. The piece closes by reiterating that the material is educational in nature and does not constitute financial advice, urging readers to conduct their own research before acting on any market view.